BLOG
Dec
2020
Move Excel Axis Up, Down, Left, or Right
I had a tough time finding the exact series of steps to get an axis to move in Excel (either the X-axis up and down, or the Y-axis left and right). Here’s what I figured out!
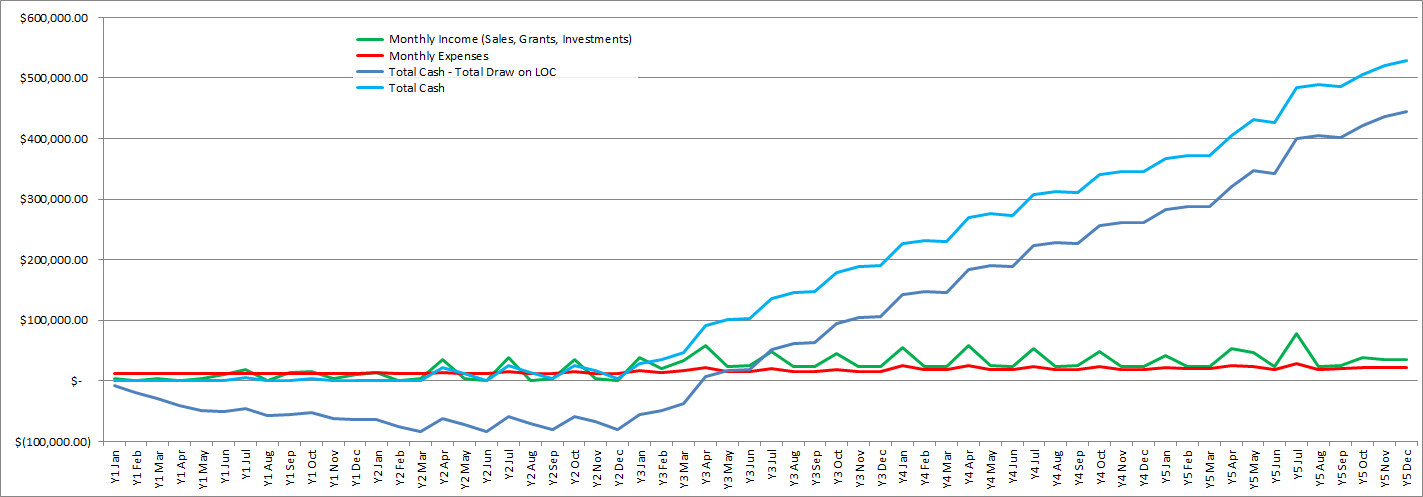
Let’s say you have the following graph, and you need to move the X-axis down to avoid coverup up the line.
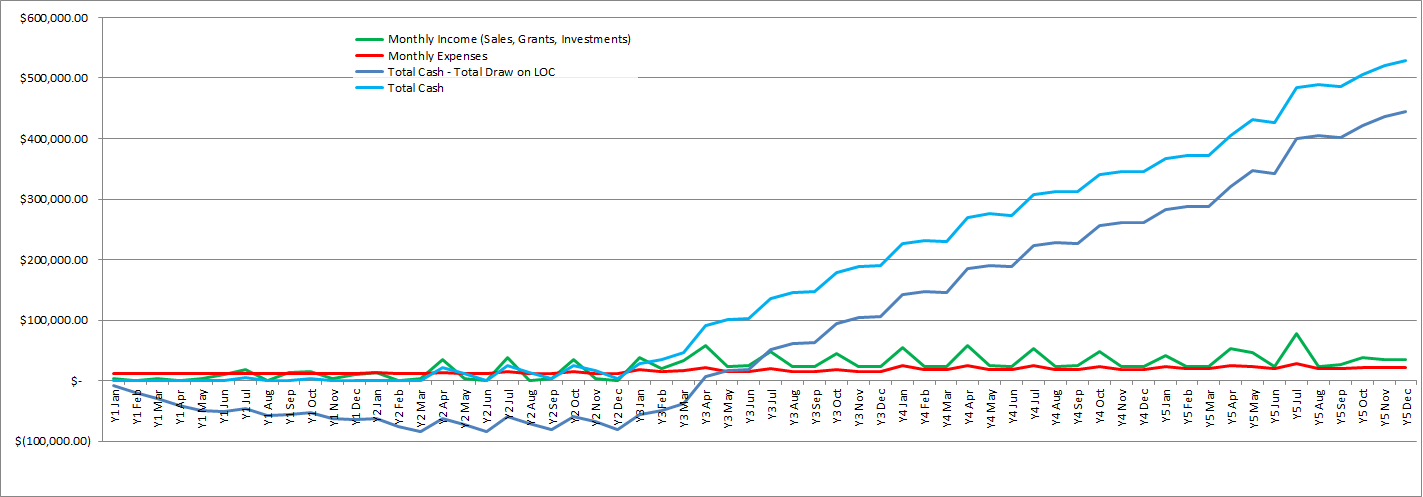
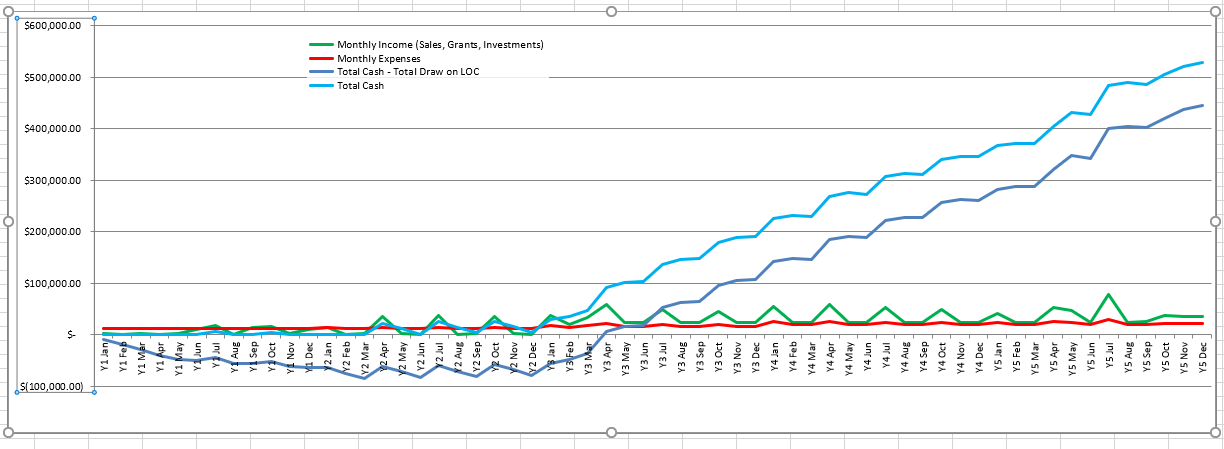
The first thing you need to do is click on the Y-axis (yes, I know I said we’re moving the X-axis – that’s what’s so confusing!) It may require two clicks, one on the chart and then another on the axis. You’ll know the axis is selected when there are blue dots in the corners of the selection, like the image below.
With the axis selected, right click and go to “Format Axis”.

In the Format Axis window that pops up, make sure that the icon on the far-right is selected (it looks like a bar graph with 3 bars).
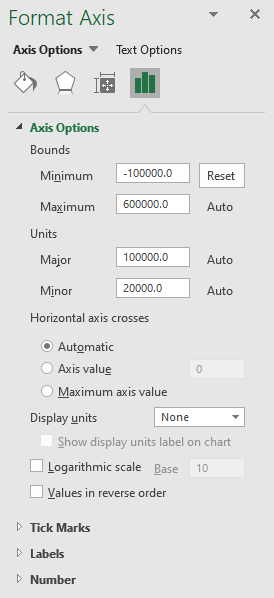
Note in the image above under “Axis Options”, you can see that “Horizontal axis crosses” is set to “Automatic”. This horizontal axis is the X-axis, which is controlled in this menu of the Y-axis. Because we don’t like the Automatic value, we’ll have to change it to “Axis value”. Looking at the chart above, we can see that the lowest value displayed on the Y axis is -$100,000. Therefore, I set that value to -100,000.
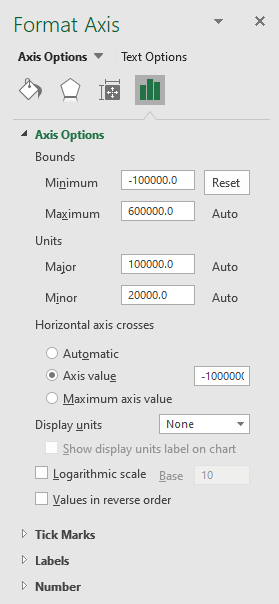
And just like that, the graph looks perfect!
Any advice on moving the vertical axis?